The 6% deficit, post-lore economy
Three years with five reliable recession signals, five recession scares, and no recession
Also on Advisor Perspectives
At the last FOMC meeting press conference, Chairman of the Federal Reserve Jerome Powell, gave an explanation why some wanted to pause cutting rates at the December meeting and others didn’t,
I think for some part of the Committee, it’s time to maybe take a step back and see whether there really are downside risks to the labor market, or see whether, in fact, the growth—that the stronger growth that we’re seeing is real. Ordinarily, the labor market is a better indicator of the momentum of the economy than the spending data. That’s the lore.
The “lore” as Powell put it, is the idea that payroll growth falling near-to-zero has occurred near the start of past recessions, leading to a much worse labor market and weaker spending. 3-month average payroll growth fell to just 18 thousand jobs per month in August. This is why part of the Fed became so dovish and the bond market priced-in several cuts ahead—the beginnings of a recession response in monetary policy.
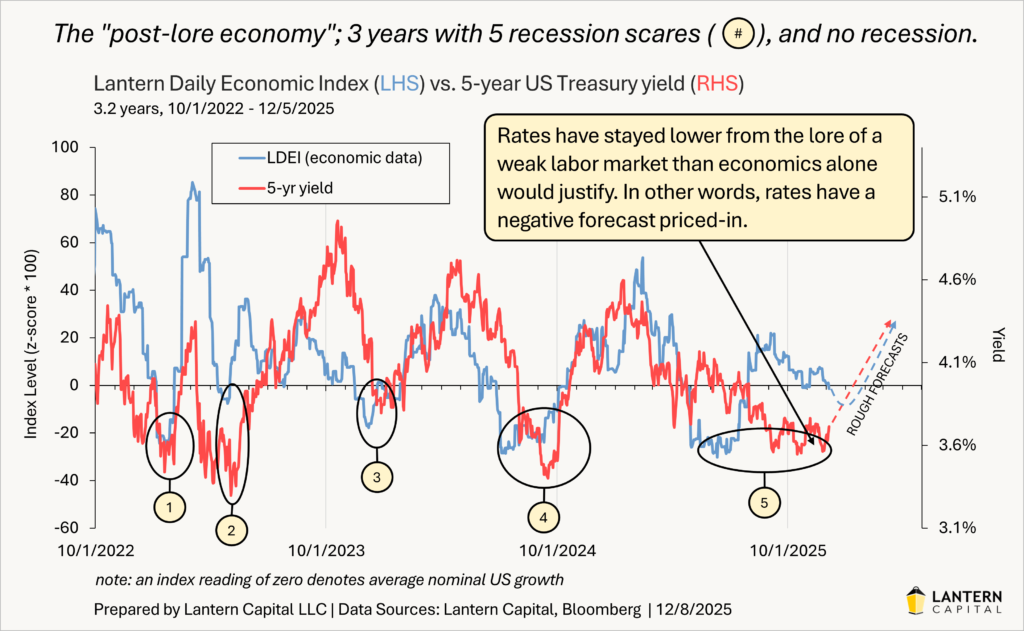
But, zooming out, this is just the latest iteration of a well-worn pattern over the last three years; different from all business cycles preceding it. It is the fifth time the bond market began to price in a recession with a weak economy (chart below) and near-zero payroll growth is the fifth in a series of reliable recession indicators over the same period [1]. Four major signals came before it: the Conference Board’s Leading Economic Index down more than 3% from its peak in 7/2022 [2] (now down 18%), the Sahm Rule triggering in 7/2024 [3], yield curve inversion (7/2022) and de-inversion in 9/2024 [4], and negative real consumer spending over six months this June [5]. Despite these signals’ strong records of predicting or confirming recessions, they have all come and gone without one. In a sentence, the lore isn’t working this time.
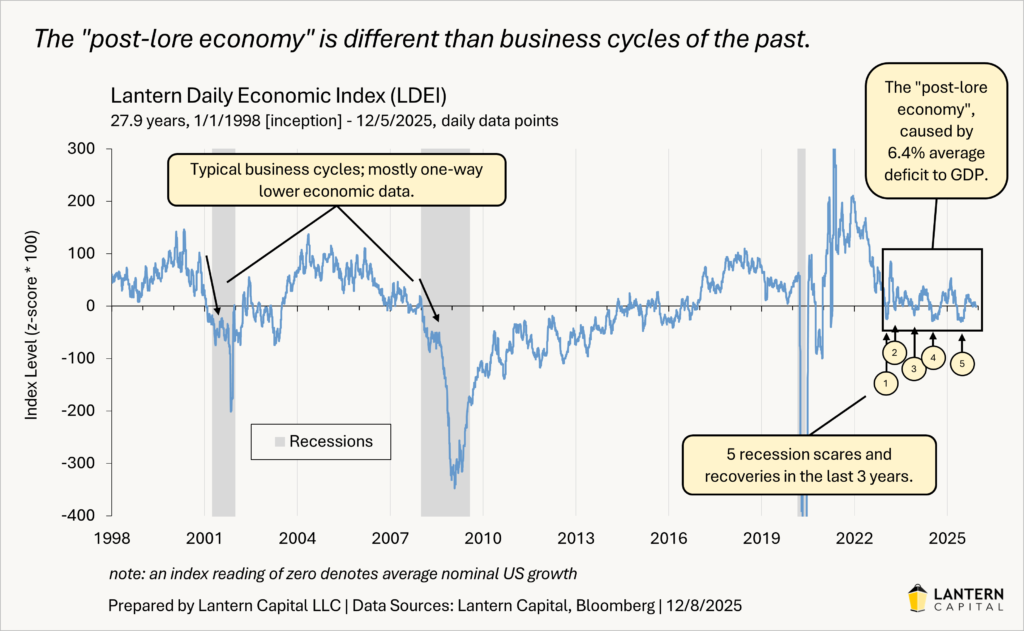
The LDEI is a daily weighted average of 45 high-quality, long-term, and well-known economic indicators. It represents a picture of the “totality of the data”, a term the Fed coined to include real, inflation, and survey/soft data. The index correlates well to nominal GDP but with 65-times the resolution showing shorter-term trends that Treasury yields, the Fed’s tone, and Fed policy tend to move with. More information here. LTRNLDEI <index> on Bloomberg.
For three reasons, low payroll growth will become the fifth false alarm. First, by the LDEI or GDP expectations, the overall economy has already recovered from the wave of depressed economics in the spring and sustained it for four months [6]. In other words, to answer Jerome Powell’s quote above, the stronger growth we’re seeing is real. Consumer spending less inflation (69% of economy) rose 2.7% annualized in Q3 and Chicago Fed CARTS data suggests it has risen another 1.8% annualized through 2/3rds of Q4. Note: economists expect Q4 to be temporarily soft because of the government shutdown. Industrial indicators have risen since mid-June [7] and housing indicators have risen since late September [8]. The Beige Book, the Fed’s semi-quarterly report on anecdotal assessments of business activity, has shown an improving economy too with less of the economy in recession over the last three months [9]. The economy is doing well.
Second, the labor market is stronger than low payroll growth makes it seem. Low or possibly negative population growth from immigration policy is causing significantly lower payroll numbers. The economy’s breakeven rate of payroll growth to a stable unemployment rate is estimated to be below 50k/mo. now coming from about 150k/mo. in April. Essentially, no growth in payrolls now is equivalent to 100k+ jobs before April. Flat payroll growth over the last three months [10] shows gradual cooling of the labor market, but not a cyclical downturn.
This is clearer when noticing most other indicators of the labor market are not matching the weakness in payroll growth. As Austan Goolsbee, President of the Chicago Fed, said all the way back at the Jackson Hole conference in August (Bloomberg’s “Odd Lots” podcast, 8/23/2025),
I was a little, not puzzled, but a little concerned that the market reaction [to the July payroll report] seemed to be, “let’s take our understanding of monthly payroll numbers circa 2018, and say that must mean we are on the verge of recession. If that’s where your head is, that you say well a low monthly payroll in the past is an indicator of the beginning of recession, then you gotta explain why these other ones don’t show that. Why is the layoff rate as low as it is? You haven’t seen an uptick in layoffs. The vacancy rate is actually rising a little and is better than it was in 2019 I think. So, this doesn’t look like a normal business cycle yet. If it starts to, I’ll be the first one saying this is what the beginning of a recession looks like.
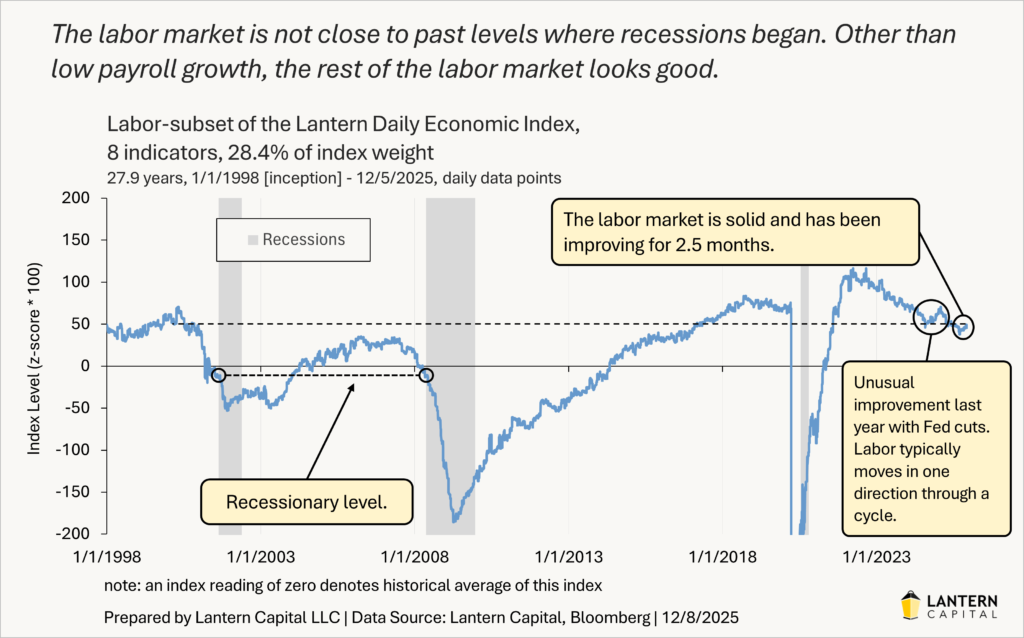
His messaging and the economic data haven’t changed since then. This concept is best illustrated through the labor market subset of the LDEI, an objective blend of the eight highest quality labor market indicators. The level of this index is much higher than the beginnings of previous recessions because mass layoffs haven’t materialized, the unemployment rate is low, and job openings are high (chart below). Also, this subset index has been improving for two and a half months from better payrolls, lower jobless claims, and rising employment sub-indices in the ISM service and manufacturing surveys [11].
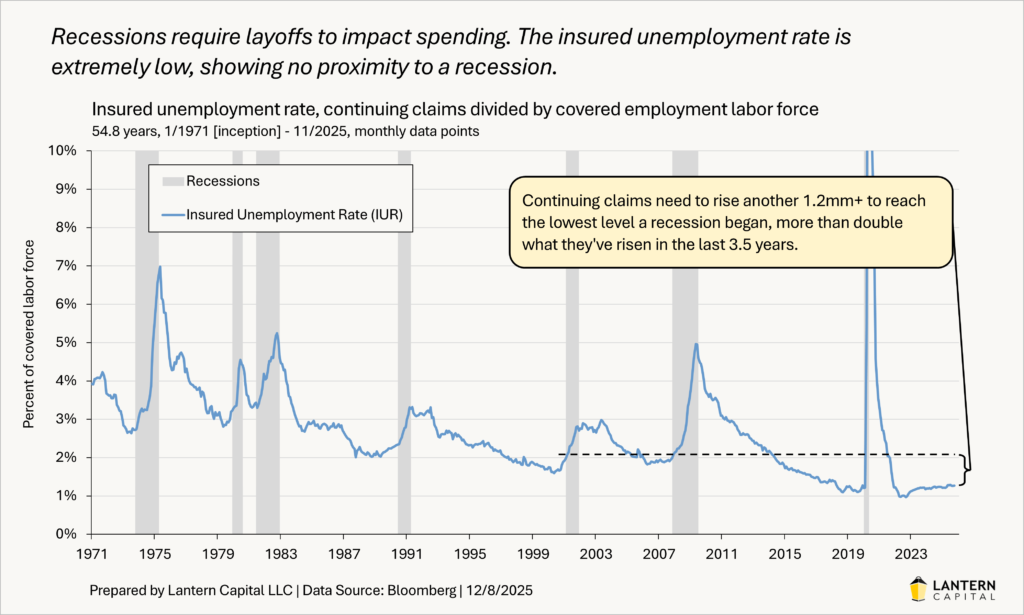
Mass layoffs are a crucial component to a recession because they directly impact consumer spending where low payroll growth doesn’t distinguish between firing and lack of hiring; the latter of which doesn’t logically change spending. Usually, they go together, but not in this cycle. Layoffs are best seen through initial and continuing jobless claims; reliable series that go back to 1967. Continuing claims are well correlated to the unemployment rate with a lead and remain extremely low (chart below). For the insured unemployment rate (based on continuing claims) to rise to the lowest level where any past recession has begun (2001, ex. COVID-19), continuing jobless claims would need to rise another 1.2 million, more than double what they’ve risen over the last 3.5 years [12].
Third, stocks and corporate bonds are too strong. Since the Great Depression, the stock market (S&P 500) made a cyclical peak an average of six months before recessions and never after [13]. Sometimes that distance was closer, such as the stock market making a cyclical peak only two months before the Great Recession began in December 2007. But even in that period, corporate bond spreads started rising seven months ahead of it in May. By the time the recession began, high yield corporate bond spreads had risen to 570 basis points. They are now less than half of that, 264 basis points and just 16 basis points over a 17-year low made last November [14]. Broad corporate weakness should be evident someplace for an economy-wide recession.
There is a lot to develop before a recession looks near.
So, why all these recession scares, recession signals, and no recession? It is the elephant in the room, the enormous pro-cyclical fiscal deficit, running an average of 6.4% of GDP for the last three years, more than double its 57-year economic expansion average of 3.1% (chart below). Large fiscal deficits are typically used to mitigate recessions and speed up their recoveries (green arrows in chart below), but starting in Trump’s first term, sustained large deficits began to be used in expansions (pro-cyclical deficits, red arrows in chart below), which Biden continued well after the pandemic and Trump is continuing in his second term.
Fiscal deficits keep the economy more buoyant than would otherwise be the case and are the most logical reason why the economy has remained in a state of purgatory at the top of this business cycle. The deficit is important to re-acknowledge because of how massive it is (biggest pro-cyclical deficit since WWII), how long it has been this way in an expansion (three years), and because it isn’t going away. It is expected to remain around 6% of GDP in 2026 with several fiscal elements of the One Big Beautiful Bill Act taking effect in January.
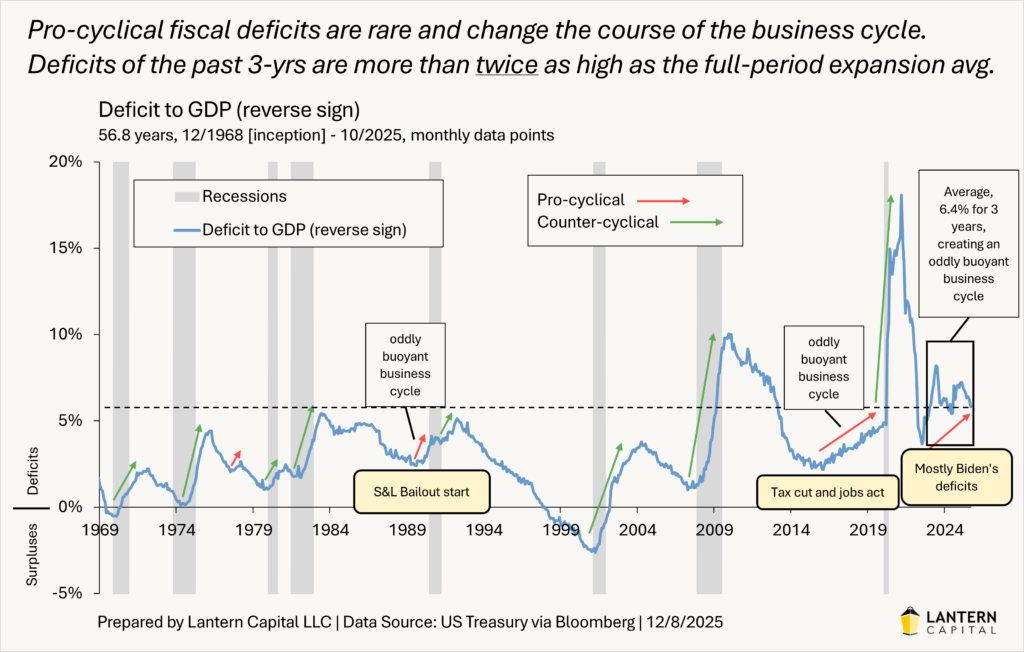
Deficits don’t create a continuously better economy. The business cycle still tries to poke through (like February to June this year and four times before that over the last three years), but every time Treasury yields have fallen about 100 basis points in a slump, the underlying economy is healthy enough such that these somewhat looser financial conditions are seemingly all it takes for the economy to recover. Then, as the economy improves, interest rates have risen about 100 basis points before tighter financial conditions constrict the economy enough that it weakens again, creating a stationary wave pattern correlated with interest rates for the last three years (chart below). While some of the inflection points (high and low) have idiosyncratic reasonings like the Fed’s Bank Term Funding Program (BTFP) in #2 or fading tariff uncertainty in #5, most don’t other than high or low Treasury yields.
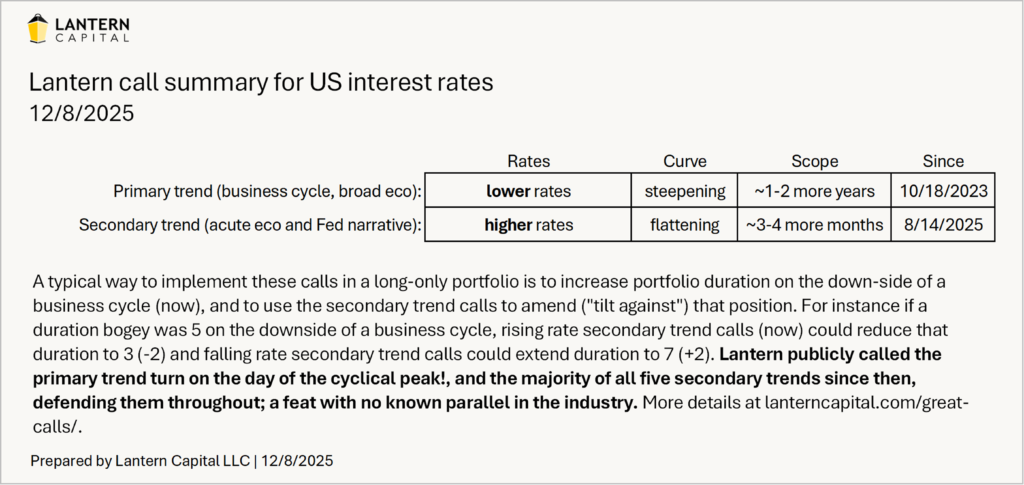
Because of the three-year deficit-suspended wave pattern and nothing to interrupt it, the economy having already recovered, and low stimulative Treasury yields, I expect this “post-lore economy” will continue with more solid economic growth, a labor market recovery like after the Fed cut rates last year, a paused Fed, and significantly higher Treasury yields. Barring event risk, the economy will only turn back around again negatively once Treasury yields have risen enough to restrict it. To summarize Lantern’s U.S. Treasury yield call:
The business cycle isn’t immortal, however. Eventually, weaknesses/imbalances that have been building for years (rising consumer loan delinquencies, a slowly weakening labor market, and an elderly 17-year bull stock market supercycle) will accrue enough to overwhelm the deficit into a recession. The business/interest-rate cycle, as indexed by the yield curve, is still in the early stages of its downtrend. Interest rate cycles tend to end with the yield curve (10yr minus 2yr) around 2.0%-3.0%, currently just 0.6%. But, wait for the following three conditions concurrently to know when the “post-lore economy” pattern has been broken and a recession is close:
1. Broad and sustained corporate weakness (stocks down, credit spreads up, deteriorating loan availability [15]).
2. Continuing jobless claims trending much higher.
3. Overall nominal economy trending lower (LDEI).
Until then, the post-lore wave pattern should be the expectation, not the surprise. Mistaking now for low-deficit business cycles of the past will result in an overly easy Fed [16], more inflation, and extreme Treasury yield volatility. A recession isn’t imminent.